Why Is GPU Utilization Low During AI Training? 6 Bottlenecks to Check
You bought the GPUs to make AI training faster. So why are they sitting idle?
When GPU utilization drops during a training run, the obvious answer is to blame the accelerator. Maybe the workload is too small. Maybe the GPU isn't powerful enough. Maybe it's time to add more hardware.
But what if the GPU isn't the problem at all?
A training workload is only as fast as the infrastructure feeding it. If the CPU takes too long to prepare a batch, storage can't deliver data fast enough, PCIe or NVLink becomes a bottleneck, or one worker falls behind the rest of the cluster, the GPU has no choice but to wait.
And when you're running expensive accelerators across multi-node training clusters, waiting is expensive.
Before you add another GPU to the rack, find out what's keeping the NVIDIA or AMD GPUs you already own from working.
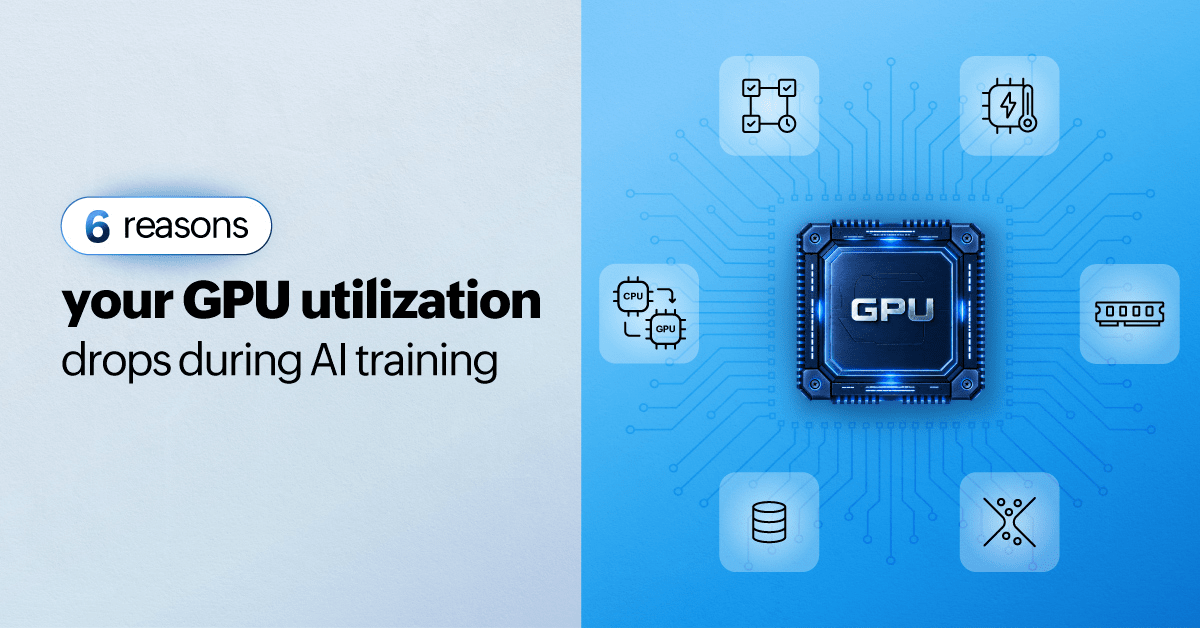
Here are six bottlenecks worth checking. In this blog, we'll address each of them.
Your CPU is starving the GPU
Your storage can't feed the training pipeline
Your data is getting stuck on the way to the GPU
Your VRAM is under pressure
Your GPU is being slowed down by heat or power limits
One slow worker can hold back the entire cluster
1. Your CPU is starving the GPU
The GPU cannot process data it hasn't received.
Tokenization, preprocessing, augmentation, and data loading all put work on the host CPU. If those processes cannot prepare the next batch quickly enough, the GPU finishes its current work and waits.
Overall CPU utilization isn't enough to diagnose this. A few heavily loaded cores or data-loading processes can become bottlenecks even when average CPU utilization looks normal.
Correlate CPU activity with GPU utilization to see whether the problem starts before data reaches the accelerator.
2. Your storage can't feed the training pipeline
AI training workloads can continuously read large datasets and write checkpoints. If the storage layer cannot keep up, the data pipeline can become the bottleneck.
You may see GPU utilization rise while a batch is being processed and then fall while the next batch is being fetched.
Check disk storage throughput, I/O latency, read/write operations, and queue depth alongside GPU utilization. If disk storage latency increases when GPU utilization drops, the accelerator may simply be waiting for data.
This becomes especially important when training workloads depend on shared or networked storage.
3. Your data is getting stuck on the way to the GPU
Even when the CPU and disk storage are healthy, data still needs a fast path to the accelerator.
PCIe handles host-to-device and device-to-host transfers, while NVLink provides high-speed communication between GPUs. If these interconnects become congested or degraded, compute resources can spend more time waiting for data.
Look beyond whether the GPU is "up." Monitor PCIe RX/TX throughput, PCIe link generation and width, and NVLink throughput and error counters to determine whether the data path is limiting performance.
In multi-GPU training, this becomes even more important because communication between accelerators is part of the workload itself.
4. Your VRAM is under pressure
A simple "VRAM used" percentage doesn't always tell the whole story.
Frameworks such as PyTorch use caching allocators that reserve memory for workloads. Memory can also become fragmented over time. That means a GPU can appear to have available memory while still struggling to satisfy a large allocation.
The result can be degraded performance or an unexpected out-of-memory failure.
Look beyond a single VRAM utilization number. Monitor used and free VRAM, memory utilization trends, and per-process memory consumption over time to identify growing memory pressure. A steady climb toward capacity, or a process retaining memory it should have released, can reveal issues before an out-of-memory condition brings training down.
5. Your GPU is being slowed down by heat or power limits
A GPU doesn't have to fail to become a performance problem.
In high-density AI environments, sustained workloads can push thermal and power limits. When that happens, the GPU can automatically reduce its clock frequency to protect the hardware.
From the outside, the server may still look completely healthy.
That's why temperature alone isn't enough. Monitor GPU temperature alongside power consumption, configured power limits, and throttle reasons. These signals can show whether thermal or power constraints are quietly reducing performance.
6. One slow worker can hold back the entire cluster
Distributed training adds another problem: synchronization.
When a training workload spans multiple GPUs or nodes, workers need to exchange data and synchronize before continuing. If one worker falls behind because of a CPU, disk storage, network, thermal, or configuration issue, other workers may spend time waiting for it.
This means a cluster can have plenty of available compute capacity while the training job still progresses slowly.
Compare GPU activity across nodes instead of relying on cluster averages. Then correlate the slowest nodes with their CPU, memory, storage, network, and process metrics.
Process-level visibility matters here too. An orphaned CUDA process from a failed job can continue holding GPU memory or execution resources, creating an underutilized or imbalanced node.
Before you buy more GPUs, find the bottleneck
Low GPU utilization doesn't automatically mean you need more compute. Your existing accelerators may already have enough capacity. They may simply be waiting for data, memory, communication, cooling, or another worker.
The GPU is part of a much larger pipeline, and monitoring it in isolation can tell you that utilization is low without telling you why.
That's where cross-layer visibility matters. ManageEngine OpManager Nexus supports both NVIDIA and AMD GPUs, bringing GPU telemetry together with host compute, system memory, storage, networking, and operating system metrics, helping IT teams correlate performance across the infrastructure and pinpoint what's holding their AI workloads back.
You don't need to stitch together data from six different tools to find the same answer. OpManager Nexus surfaces the critical signals in one place, making troubleshooting and performance analysis faster. This includes CPU core-level activity, storage I/O latency, PCIe and NVLink throughput, VRAM consumption, deep GPU profiling metrics, and per-node GPU comparisons.
Because sometimes the fastest way to get more from your GPUs isn't to buy more GPUs. It's to remove the bottleneck standing in their way. Explore ManageEngine OpManager Nexus to gain unified visibility across your AI infrastructure.
FAQ
Why is GPU utilization low during AI training?
GPU utilization is often low because the GPU is waiting on another part of the pipeline, not because the hardware is underpowered. Common causes include slow data preparation on the CPU, storage that can't feed data fast enough, congested PCIe or NVLink transfers, memory pressure, thermal or power throttling, or a lagging worker in distributed training.How do you check if the CPU is bottlenecking GPU training?
Correlate CPU activity with GPU utilization over time rather than checking average CPU load alone. If GPU utilization drops whenever the CPU is preparing the next batch, or a few cores are heavily loaded while overall usage looks normal, the CPU is likely the bottleneck.Can slow storage cause low GPU utilization?
Yes. If storage can't read data or write checkpoints fast enough, the GPU finishes a batch and sits idle waiting for the next one. This appears as GPU utilization rising and falling in sync with disk I/O latency, throughput, and queue depth, especially on shared or networked storage.What's the difference between PCIe and NVLink bottlenecks?
PCIe moves data between the CPU and GPU, while NVLink handles high-speed communication between GPUs. Congestion in either interconnect forces the GPU to wait for data, which becomes more significant as training scales across multiple GPUs.Why does a GPU run out of memory even when VRAM shows availability?
Caching allocators used by frameworks like PyTorch reserve memory, and memory can fragment over time. A GPU can appear to have free VRAM while still failing to satisfy a large allocation, so tracking memory trends and per-process usage over time catches this before it causes a failure.Can a GPU throttle performance without appearing unhealthy?
Yes. Sustained workloads in high-density environments can push thermal or power limits, causing the GPU to automatically lower its clock speed. The server can still look healthy externally, so temperature, power draw, and throttle reasons all need to be monitored together.Why does distributed training slow down when GPU capacity looks sufficient?
One slow worker can hold back an entire training cluster because workers must synchronize before continuing. A CPU, storage, network, thermal, or configuration issue on a single node can stall the rest of the cluster even when total compute capacity appears adequate.Does adding more GPUs fix low utilization?
Not if the bottleneck is elsewhere in the pipeline. Adding GPUs when the real constraint is data delivery, memory, interconnects, cooling, or synchronization just adds more idle hardware. Identifying the actual bottleneck first is usually more effective than scaling hardware.What GPUs does OpManager Nexus support?
ManageEngine OpManager Nexus supports both NVIDIA and AMD GPUs, with unified monitoring for GPU utilization, VRAM, temperature, power consumption, PCIe performance, and deep GPM profiling metrics from a single platform